Overview
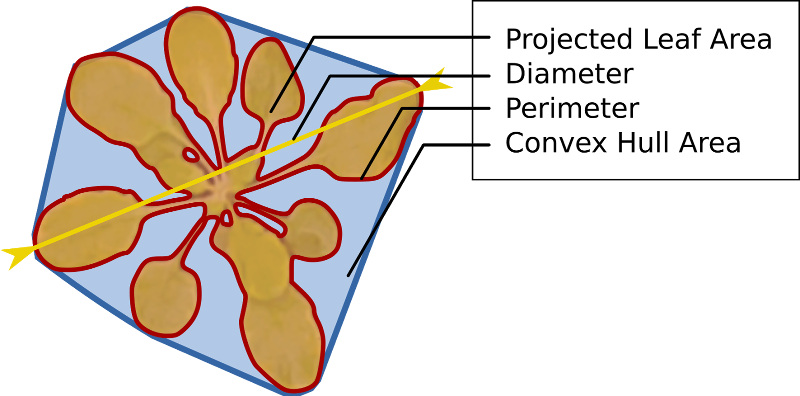
Our approach to image-based plant phenotyping is based on a distributed sensing and analysis framework. Image acquisition relies on an affordable and versatile imaging device (based on the Raspberry Pi single-board computer), that can be easily deployed for experiments with rosette plants in growth chambers or greenhouses. The acquired images can be stored on the device or with Wi-Fi can be easily downloaded to a local workstation. Optionally, the images can also be transmitted over the Internet to the BisQue platform running on the iPlant Collaborative cyber-infrastructure, offering cloud-based storage for life sciences research. The image data can be explored and analyzed on a local workstation using our standalone software, or on the iPlant cloud via web-based application, both providing an easy-to-use graphical user interface to perform sophisticated computer vision tasks powered by machine learning approaches. Our analysis system allows to delineate plant objects in the images and measure growth-related plant features (e.g., area, rosette diameter, relative growth rate, …, and leaf count). Phenotyping results are presented to the user for interpretation and can be exported for further statistical analysis. Click here to see the full range of phenotyping traits extracted by our system.
Currently our paper that describes the platform is under review and the complete software will be made available as soon as possible. If you want to obtain the software prior to its release for testing purposes please contact us.
Steps to affordable and easy phenotyping
We have prepared detailed documentation, download packages, and demos of our plant phenotyping system, that can enable your lab to phenotype growth of rosette plants in few easy steps. Once publicly released you will be free to download, use, and modify the Phenotiki software for research-only purposes. If you do so, you will have to cite relevant papers, as it is described in the Credits page and follow our licence (coming soon) and disclaimer (coming soon).

Currently we have beta testers throughout the world, if you would like to deploy the system please contact us.
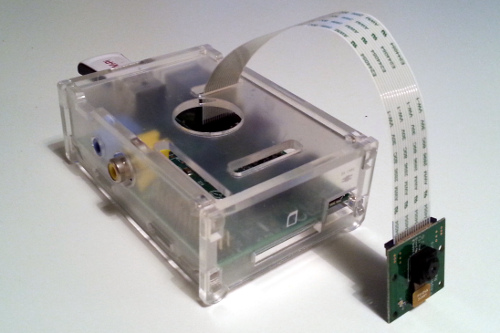
1. Obtain the Phenotiki device
Obtain hardware components of the imaging device.
- Raspberry Pi 1 Model B (or higher);
- Raspberry Pi case;
- RaspiCam camera module;
- USB WiFi dongle;
- micro USB power supply;
- 8 GB SD memory card;
- computer monitor and HDMI cable;
- self-powered USB hub;
- USB keyboard;
- USB mouse.
The equipment can be easily purchased from Farnell element14, which sells and ships worldwide. Afterwards, the Phenotiki device can be assembled following our detailed instructions in the  user manual. Install the device in the growth chamber above the plants.
2. Configure the device
Connect the Phenotiki device to the Internet and then configure time-lapse acquisition from its web-based interface, which can be accessed from any browser (even on a mobile phone).
Detailed instructions to setup the Phenotiki device are available in the user manual.
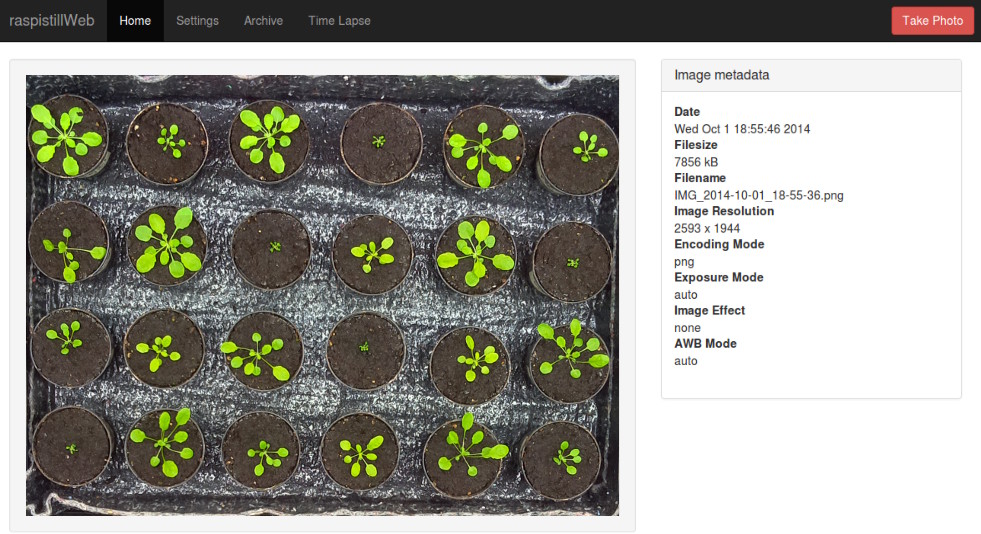
3. Launch time-lapse image acquisition
From the web-based interface of the Phenotiki device, launch a time-lapse image acquisition. You can now close the browser and let the device operate autonomously. By default images will be stored on the device.
You can also setup the device to automatically transmit the acquired images to the BisQue platform on the iPlant cloud infrastructure. Note that you need an account for iPlant/CyVerse to do that.
Upon completion, open the device interface and download images to a local computer as a ZIP archive. If you configured transmission to BisQue, you can browse the images on the web-based BisQue platform as they are acquired by the device.
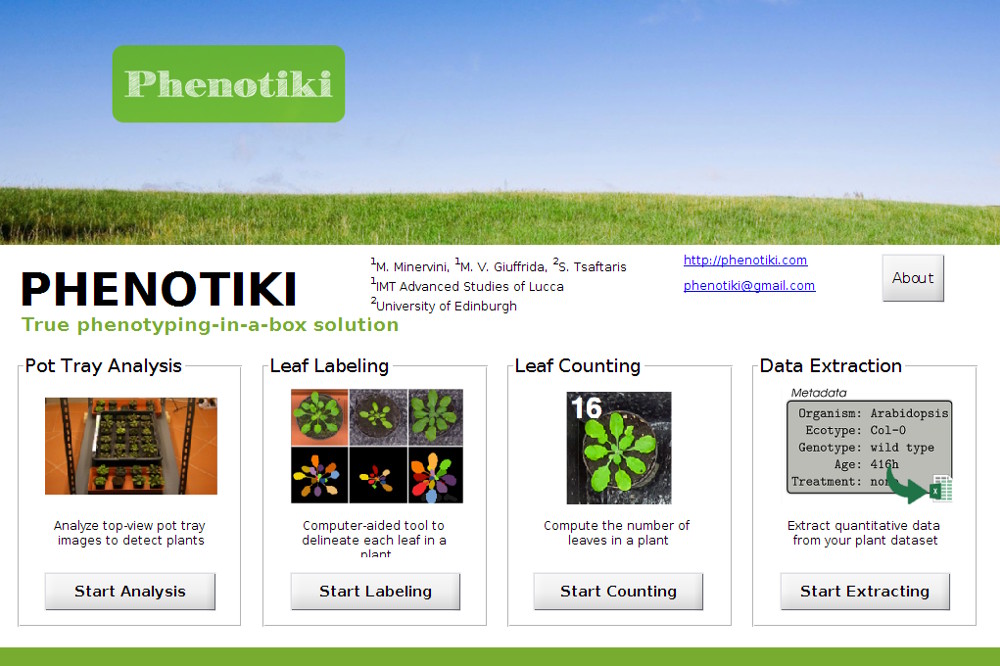
4. Analyze image data
Analyze the acquired image data using the Phenotiki software on a workstation (standalone Matlab software) or on the cloud via web-based applications running on BisQue. The Phenotiki analysis software for image-based phenotyping of rosette plants is available in two versions: standalone and web-based.
4.1. Standalone software
The standalone version is implemented in Matlab and offers an easy-to-use graphical interface that integrates modules to perform several analysis tasks such as plant segmentation and leaf counting. Usage instructions are available in the user manual.
4.2. Web-based software
The web-based version is deployed on the iPlant Collaborative cloud infrastructure. The analysis modules will be made available soon on the BisQue platform (an iPlant/CyVerse user account will be necessary to log in).
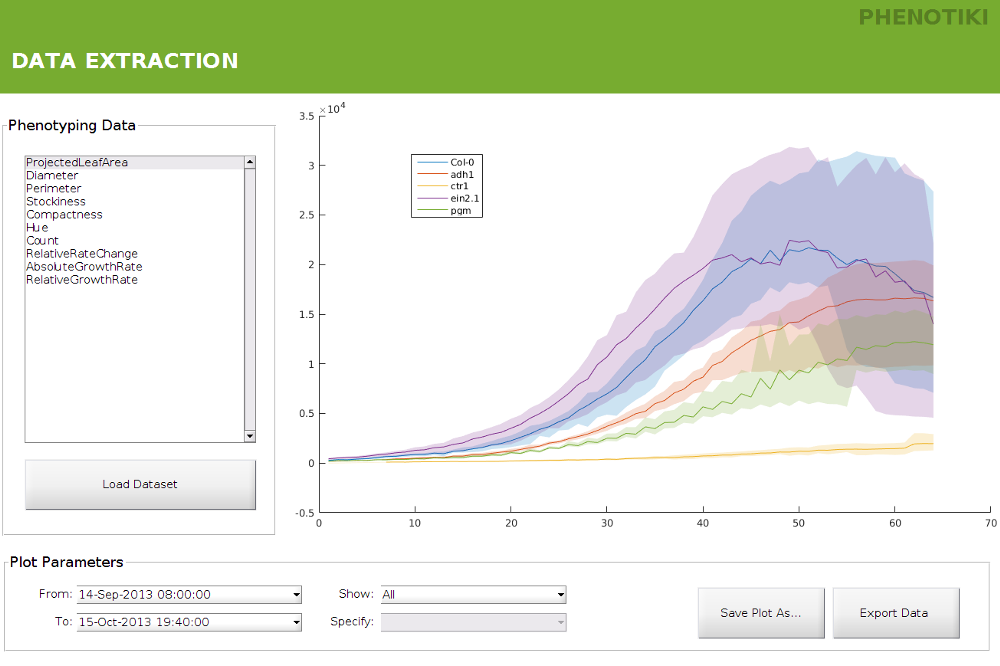
5. Obtain phenotyping results
Visualize phenotyping results by plotting several growth traits over time. Results can also be exported to spreadsheets for further analysis. We extract several traits such as projected leaf area, rosette diameter, and leaf count. Please see this page for a detailed list of the traits currently extracted.